Here is a quick test. Open your company's current Ideal Customer Profile. Can you, right now, use it to produce a ranked list of named accounts to pursue this quarter, with the best-fit accounts at the top and a defensible reason for the order?
If the answer is no, if your ICP is a paragraph that reads something like "mid-market SaaS companies with a modern tech stack who value data-driven decision-making," then you do not have an ICP. You have a horoscope. And a horoscope cannot drive account-based marketing, because ABM begins and ends with which accounts. Get the account list wrong and every downstream dollar (the content, the ads, the SDR hours, the executive time) is spent courting the wrong companies with great professionalism. No amount of execution rescues a bad list, in the same way no amount of navigation rescues the wrong destination.
This is why many teams "try ABM and fail." Not the plays. The list. Our State of ABM 2026-2027 report has more on why the account, not the lead, is now the unit that matters. And the list is bad because the ICP behind it was aspirational prose where a scoring model should have been.
This guide shows you how to build an ICP that is an actual model: three layers of weighted criteria, drawn from your real data, that output a tiered, ranked, and refreshingly dynamic account list. It is more work than writing a paragraph. It is also the difference between ABM that compounds and ABM that stalls with dignity.
Why the paragraph-style ICP fails
The traditional ICP fails for three specific reasons, and naming them is useful, because each one comes with a fix.
It is aspirational, not empirical. Most ICPs describe the customer the company wishes it had, the prestigious logo and the fat budget, rather than the customer it actually wins, keeps, and expands. The fix is to derive the ICP from closed-won and retention data, not from the mood in the room at the strategy offsite.
It is descriptive, not operational. "Companies that value innovation" cannot be queried in a database, because "values innovation" is not a filter, it is a compliment. The fix is to translate every criterion into something you can actually sort and score on.
It is binary, not scored. A paragraph implies an account either "fits" or "doesn't." Reality is a gradient: some accounts are a 95% fit, some a 60% fit, and you should treat them very differently rather than herding them into the same campaign. The fix is a score, which lets you rank and tier instead of guess.
The model below repairs all three.
Step 1: Mine your best customers (the part everyone skips)
Before you define a single criterion, you study the customers you already have. This is non-negotiable, and it is where the real ICP comes from. Aspiration goes in the bin; evidence goes in the model.
Pull your customer base and identify your best customers. Not your biggest, your best. Best means some combination of these: closed at a healthy win rate, ramped quickly, renewed, expanded over time, and stayed cheap to serve. These are the accounts you would happily clone if cloning were legal. Then do the same at the opposite end: customers who churned, drained your team, or never adopted. They define your anti-ICP, which is every bit as valuable and considerably less flattering.
Now interrogate both groups for patterns. What did the best customers share at the moment you sold to them? What did the churned ones have in common? You are hunting for the attributes that predict a good outcome, and they sort neatly into three layers.
Step 2: The three layers of the model
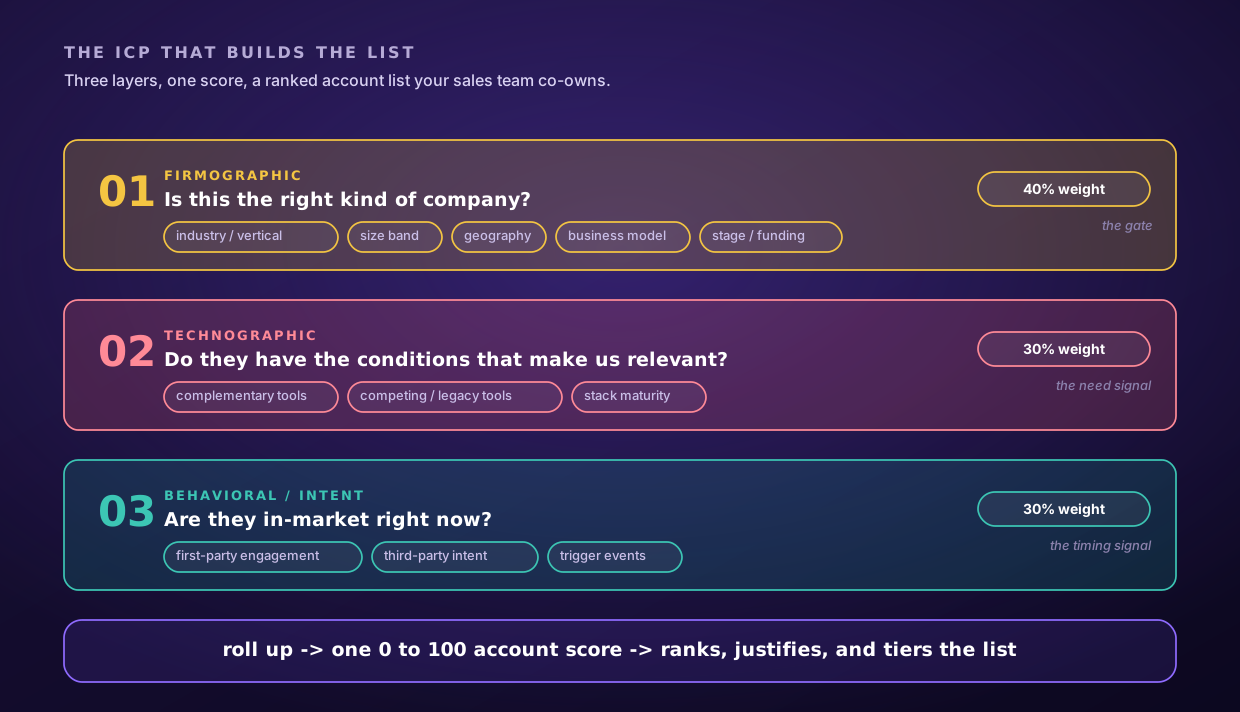
A complete ABM ICP scores accounts across three distinct layers. Each answers a different question, and you need all three, because any one alone will lie to you with total confidence.
Layer 1, Firmographic: Is this the right kind of company?
The structural attributes of the account. These are the table-stakes filters, and they tend to be the easiest to source.
- Industry or vertical, and be specific. Not "technology" but "B2B vertical SaaS in regulated industries."
- Company size, by employee count or revenue band. Your best customers usually cluster inside a band; your job is to find its edges.
- Geography, meaning where you can genuinely sell, support, and comply, rather than where you would enjoy visiting.
- Business model, which is sometimes the sharpest predictor of all. A company running a sales-led motion may need your product far more than an identical-sized company running pure self-serve.
- Growth stage or funding. Recently funded companies often carry the budget and the urgency that comfortable, mature ones have misplaced.
Firmographics get you to "this is plausibly the right kind of company." They are necessary and cheerfully insufficient on their own. Two companies that look identical on firmographics can have wildly different odds of buying, which is exactly why the next two layers exist.
Layer 2, Technographic: Do they have the conditions that make our product relevant?
What an account uses, and what that reveals about their needs, is often a sharper predictor than how big they are. Technographics ask whether the account has the specific conditions your product was built to address.
- Complementary tools: products that mark them as the kind of company that buys things like yours, or that you integrate with. If you sell an ABM platform, a company already running a serious CRM and marketing automation is far readier for you than one still living in spreadsheets.
- Competing or legacy tools: the incumbents you displace, whose public pages are one way to read who they actually target. A company running the exact legacy product you replace is not a prospect, it is a pain point with a budget.
- Technical sophistication and stack maturity: whether their environment can actually adopt your product and extract value, or whether it would sit unused like a gym membership in February.
Technographics are powerful because they surface latent need. A mid-market fintech still nursing a legacy billing system is not merely "the right size." It has the precise problem you solve, today, whether or not it has admitted it out loud.
Layer 3, Behavioral and intent: Are they in-market right now?
The first two layers tell you who to target. This layer tells you when. It is the difference between a static wish list and a dynamic, prioritized one, and it is the layer most ICPs omit entirely, which is a bit like planning a wedding without checking whether the other person is interested.
- First-party engagement: are people at this account reading your content, visiting pricing pages, showing up to your webinars, replying to your emails? Repeated, deepening engagement from several people at one account is one of the strongest signals we score.
- Third-party intent: are they researching your category across the web? Roughly 91% of B2B technology marketers now use intent data precisely to catch accounts the moment they wander into the market.
- Trigger events: new funding, a relevant executive hire, an acquisition, a regulatory change, expansion into a new market, or public hiring for roles that imply your problem. Trigger events are gold, because they create both urgency and a natural, non-awkward reason to reach out.
Behavioral signals are why your ICP must be dynamic. We rank the thirty that actually predict pipeline in the buying signals worth scoring, including the eight to delete. Fit (Layers 1 and 2) is relatively stable; timing (Layer 3) changes by the week. An account can be a flawless fit for two years and only become a priority the Tuesday it raises a round or its champion changes jobs.
Step 3: Turn it into a scorecard
Now you assemble the layers into an actual scoring model. The mechanics are simple; the discipline lives in deriving the weights from your data rather than your gut, which will always vote for the exciting logo.
Give each layer a weight based on how predictive it proved in your best-customer analysis. A defensible default for many B2B companies looks like this:
- Firmographic fit: 40%. The gate. Get this wrong and nothing downstream matters.
- Technographic fit: 30%. The need signal.
- Behavioral and intent: 30%. The timing signal.
Within each layer, score the individual criteria (say 0 to 10 for industry match, 0 to 10 for size band, and so on), weight them, and roll everything up into a single 0 to 100 account score. The exact weights matter less than the principle: the weights come from what actually predicted good outcomes in your customer base, and you revisit them as you learn more.
The output is a list of named accounts, each carrying a score. That score does three jobs at once. It ranks the list, it justifies the order to a sceptical sales team, and it slots each account into a tier without a debate.
If you want an engagement scoring model to sit next to this fit model, our RFE Account Scoring Playbook is the transparent 100-point framework we use for the account and lead layer.
Step 4: Tier the list and connect it to your motion
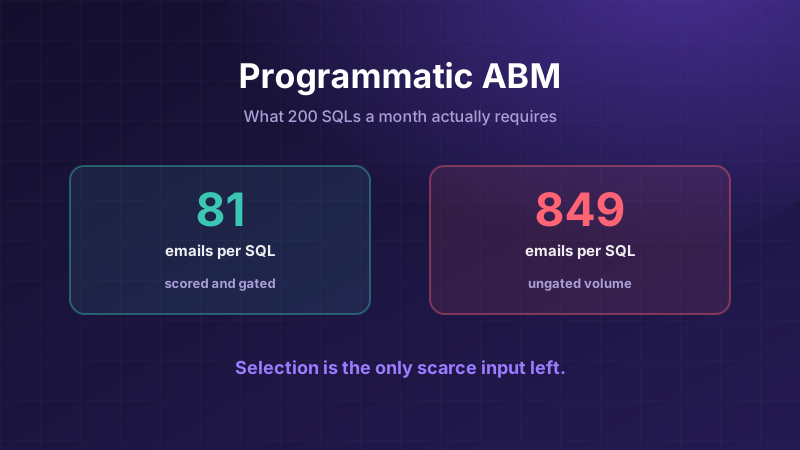
The score maps directly onto the three ABM tiers, which is the entire point. The ICP is the bridge between "who" and "what we do about it." What happens to that list every week after it exists is a separate model, and we set it out in programmatic ABM and what 200 SQLs a month actually requires.
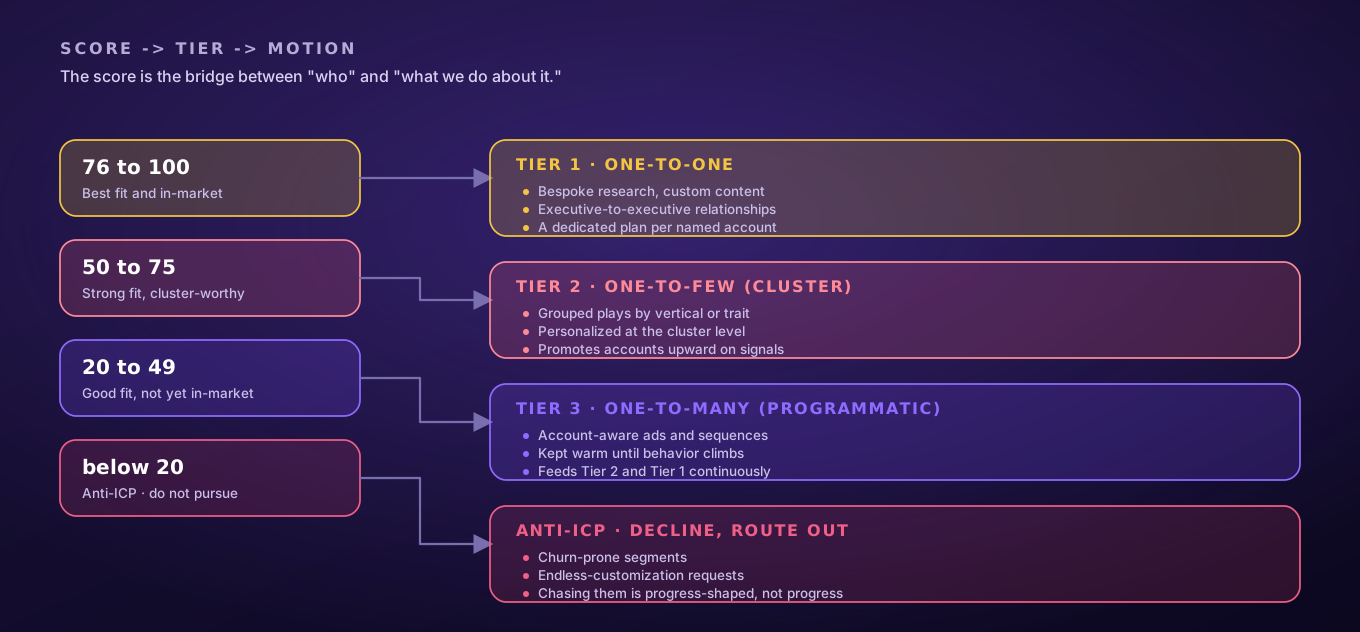
- Top scorers (best fit and in-market): Tier 1, one-to-one. A handful of accounts that justify bespoke, white-glove effort.
- Strong fit, clustered by shared traits: Tier 2, one-to-few. Grouped plays for accounts with the same vertical, the same legacy tool, or the same trigger.
- Good fit, not yet showing intent: Tier 3, one-to-many. Kept warm with programmatic, account-aware effort until their behavior score climbs and they earn a promotion.
This is also where the score earns its keep with sales. "Work these accounts because the model scores them highest on the attributes that predicted our best customers" is a very different conversation than "marketing made a list, please respect it." Bringing sales into the scoring criteria, and pulling their hard-won judgment on close calls into the model, is what gets the list co-owned rather than politely ignored.
Step 5: Define the anti-ICP, out loud
The accounts you refuse to chase matter as much as the ones you pursue, and writing them down is one of the highest-return hours you will spend. The anti-ICP falls straight out of your churn and pain analysis: the segments that churn, never adopt, demand endless customization, or take up permanent residence in procurement.
An explicit anti-ICP protects your team from the most expensive early mistake in any go-to-market motion, which is chasing revenue that looks like progress and is actually a trap with good manners. When the number is tight, the discipline to say "that account scores below our line, we pass" is genuinely hard, and it is exactly what separates focused programs from busy ones.
Keep it alive
The biggest difference between an ICP that drives results and one that gathers dust is simply that someone maintains the first one. It is the same difference between an ABM platform that earns its licence and one that decays into an expensive alert nobody actions. Fit criteria drift as your product and market evolve. Intent signals change constantly and without warning. Set a cadence: we recommend a full ICP review each quarter and a behavioral-signal refresh running continuously through your intent and engagement tooling. Every quarter, feed your latest closed-won and churn data back in and let the model re-weight itself. A static ICP slowly wanders away from reality; a maintained one gets sharper with every pass.
The bottom line
An ICP for ABM is not a description of your dream customer. It is a scoring model: firmographic fit for who, technographic fit for whether they need you, behavioral and intent signals for when. It is derived from your real best customers, expressed as a weighted 0 to 100 score, and refreshed continuously. Its output is a ranked, tiered, named account list that sales co-owns and that steers every downstream ABM dollar.
Build the model and the account list stops being an argument. It becomes a query. Turning that query into a list sales will actually work is the next problem, and it is a different one. And the program you build on top of it is, at last, pointed at the right companies.
Name three accounts at the top of your list and we will sketch the plays we would run for each, free: the trigger worth acting on, the buying-committee roles to reach, the angle and the first three touches. You keep it whether you hire us or not.